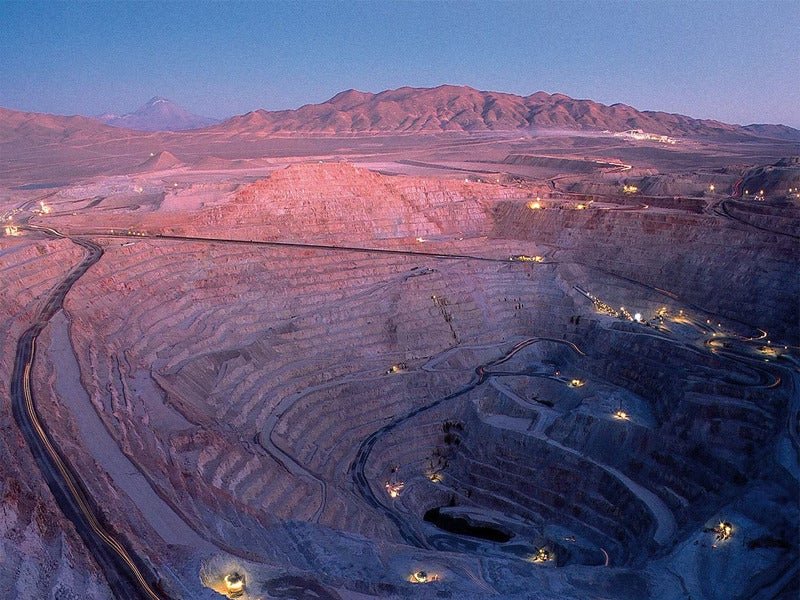
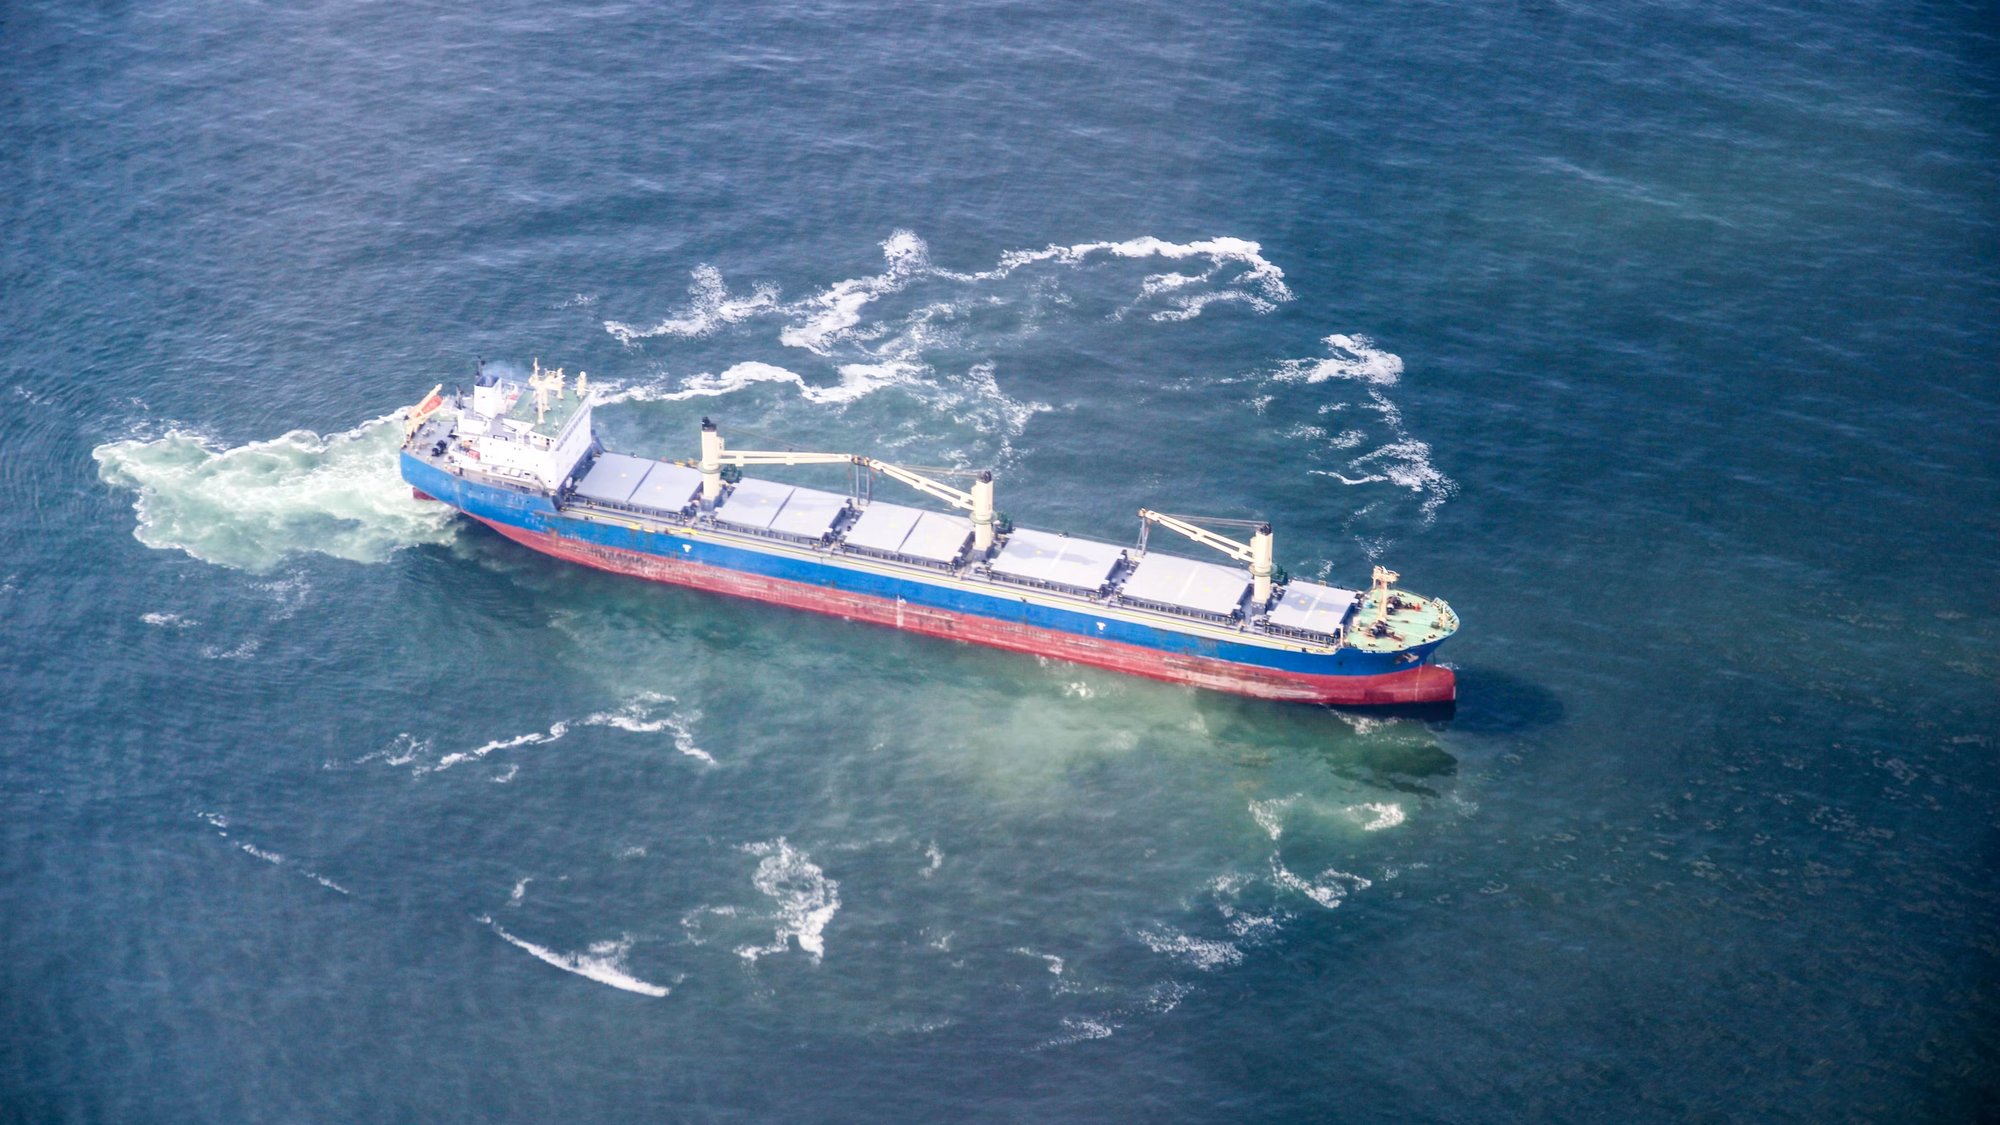
A war at the world's most important chokepoint, an aging fleet, a wall of new LNG and iron ore supply, and a tariff-fragmented trading system have rewritten the economics of moving raw materials. This is a data-grounded map of global commodity trade from 2026 to 2030 — and a playbook for the traders and shipowners who will navigate it.
On the last day of February 2026, the roughly one hundred tankers a day that carried a fifth of the world's oil and a fifth of its liquefied natural gas through the Strait of Hormuz simply stopped. Within weeks, Brent crude had posted its largest monthly rise on record, more than six hundred merchant ships were trapped inside the Persian Gulf, and the World Bank had torn up a forecast of falling commodity prices and replaced it with the first annual increase since 2022.
The war that began on 28 February 2026 — and the ceasefire, conditional reopening and uneasy interim deal that followed — did not create the forces now reshaping commodity trade. It detonated them. Demand growth was already slowing; fleets were already aging; supply was already being re-mapped from Guinea to Qatar to the Gulf of Mexico; and trade was already fragmenting along geopolitical lines. What the shock did was compress a decade of adjustment into a single year, and hand extraordinary windfalls to those positioned for volatility. This report assembles the evidence — prices, volumes, tonne-miles, fleet data and freight rates — into a coherent outlook to 2030, and closes with concrete areas of focus for physical traders and shipowners.
The war that erupted between the United States, Israel and Iran on 28 February 2026 produced what the IEA describes as the largest oil supply disruption in history. Roughly 10 million barrels per day — about a tenth of global supply — was knocked offline in the opening weeks, and transits through the Strait of Hormuz, which normally carries 20.3 million barrels per day of oil, around 30% of all seaborne crude, plus roughly a fifth of global LNG, collapsed from more than a hundred ships a day to barely three (EIA). Brent crude jumped from $72/bbl at the end of February to $118/bbl by the end of March — the largest monthly increase on record — and briefly exceeded $126 intraday in late April (World Bank / EC).
The political sequence since has been a staircase of de-escalation without resolution: a ceasefire on 7 April, a conditional Iranian "reopening" of the strait on 17 April, and a US–Iran interim arrangement in mid-June that has been extended in sixty-day increments. On the water the reality is messier. The central shipping lane remains seeded with an estimated eighty naval mines; traffic has been split between northern and southern inshore routes; and as of this writing roughly 119 laden tankers and some 550 merchant vessels remain trapped inside the Persian Gulf, including 129 container ships. EIA's October 2026 Short-Term Energy Outlook still counts 4.8 mb/d of shut-in production in September, down from a peak of 10.9 mb/d in May (EIA).
The speed of the reversal deserves emphasis. As late as January 2026 the consensus expected 2026 to be a year of oil-market surplus and softer prices; Brent had averaged just $69/bbl in 2025, its weakest year since 2020 (EIA). Instead, monthly average Brent printed $103 in March, $117 in April and $114 in September 2026, and the EIA's October STEO sees Brent averaging $105/bbl in Q4 2026 before subsiding to $87 in Q2 2027 and $74 by Q4 2027 as shut-in barrels return (EIA, EIA). The World Bank's April Commodity Markets Outlook — which assumed the most acute disruption would end by May — put the 2026 average at $86, with an adverse scenario of $95–115 if the strait stayed impaired (World Bank).
Crucially for anyone planning beyond the shock, the Bank still expects Brent to average $70 in 2027 — below its 2026 forecast but well above the pre-war trajectory. The structural message: the world has not run out of oil, but it has been reminded that a third of its seaborne supply passes through a 33-kilometre channel. Risk premia, insurance costs and freight differentials will carry that memory long after the mines are swept.
Hormuz is not only an oil artery. Qatar's LNG trains, the Persian Gulf's fertilizer plants and its aluminium smelters all ship through the same water, which is why the World Bank's April assessment raised its 2026 forecasts across the complex: energy +24%, fertilizers +31% (with urea up 60% to above $850/t), base metals +17% to record levels, and precious metals +42% — even as agriculture, the one complex with slack, was marked down 6% (World Bank). Damage to Qatar's Ras Laffan complex — two trains with a combined 12.8 mtpa, about 17% of Qatari capacity, now assessed as offline for three to five years — has tightened the late-decade LNG balance and pushed Asian utilities back toward coal, lifting April coal exports 7.5% year-on-year even in a structurally declining market.
The inflationary echo is already measurable: the World Bank estimates developing-economy consumer-price inflation at 5.1% in 2026 on the back of energy and food-pass-through, and warns that as many as 45 million additional people could be pushed toward acute food insecurity if fertilizer and grain logistics stay impaired (World Bank). For commodity trade, the second wave matters as much as the first: fertilizer affordability decides next season's planted acreage, and food-price inflation decides how hard governments lean on export restrictions — the trade-policy contagion that outlasts every shooting war.
Strip away the war premium and the underlying economy that commodity trade serves is growing, but only just. The IMF's July 2026 World Economic Outlook put global growth at 3.0% in 2026 and 3.4% in 2027, with global inflation at 4.7% — a low-altitude expansion in which commodity demand growth has to fight for every increment (IMF). The WTO, meanwhile, cut its 2026 merchandise trade growth forecast to a meagre 0.5%, a near-stall that reflects both the tariff cycle and the shipping disruptions of the first half (WTO).
The deeper structural fact is fragmentation. The OECD counts a five-fold rise in export-restricted vital inputs since 2009, and the past eighteen months have added a new layer: China's April and October 2025 rare-earth export controls covering seven strategic minerals, and the US Section 301 port-fee regime that took effect on 14 October 2025 — $50 per net ton on Chinese-operated vessels rising to $140 by 2028, and $18 per net ton on Chinese-built tonnage rising to $33 — answered by Chinese counter-fees of 400 rising to 1,120 yuan per net ton (OECD, USTR). Both fee regimes were suspended for a year from 10 November 2025 as part of the trade truce, but their architecture survives the suspension — and can be switched back on with a signature.
Nowhere is the new logic of commodity trade clearer than in the wedge between how much the world ships and how far it ships it. According to Clarksons Research data, total seaborne trade reached 12.96 billion tonnes in 2025, up 1.7%, while tonne-miles grew faster at 2.3% to 68.3 trillion. For 2026 the forecast is volumes flat to slightly negative (−0.1%) — the war, Chinese destocking and the trade truce's hangovers — yet tonne-miles still +1.3%, because sanctions, mine-infested chokepoints and the Red Sea diversion keep forcing cargo onto longer routes (Clarksons Research).
That divergence is the single most important number for shipowners in this report: demand for ships is a product of volume times distance, and in a fragmented world the distance term can stay positive even when the volume term is not. The Americas-to-East-of-Suez crude trade, for instance, grew 36% between Q1 and Q2 2026 as Atlantic-basin barrels replaced shut-in Persian Gulf supply — a classic tonne-mile windfall. Meanwhile the fleet itself grew 3.5% in 2025 and is forecast to grow 4.4% in 2026, outpacing cargo growth and capping rates in segments where newbuildings flood in (Clarksons Research).
"Demand for ships is volume times distance. In a fragmented world, distance stays positive even when volume is not."The central equation of the 2026 freight market
One more macro variable deserves the trader's attention: China. Chinese crude imports fell roughly 40% year-on-year into June 2026 as the Hormuz closure bit into its main supply line and strategic stockpiles were drawn, a shock to what had been the marginal buyer of everything from oil to iron ore (RBA). Whether 2027 brings restocking — the classic post-shock commodity pulse — is arguably the biggest single swing factor in the base case presented in Section 8.
Behind the smoke of 2026, the structural oil story has not changed — it has been postponed. The IEA's Stated Policies Scenario has global oil demand plateauing around 102 mb/d in the late 2020s, while its Current Policies Scenario — no further climate policy — sees demand still climbing to 113 mb/d by 2050; OPEC's own outlook places the peak near 113 mb/d around 2030, and BP's near 103 mb/d at the decade's end (IEA, BP). Even the most bearish agency therefore sees demand broadly flat, not falling, through the 2026–2030 window of this report: global demand ran at 103.9 mb/d in 2025 (+0.8 mb/d), with India alone adding about 1 mb/d between 2024 and 2030 as the new centre of demand gravity (IEA).
For trade — as opposed to production — the balance is subtly different. What matters for tankers is not how much oil the world burns, but how much crosses water, and from where. The post-war map is already visible: crude exports from inside the Persian Gulf fell 82% year-on-year in Q2 2026, while Atlantic-basin suppliers (the US, Brazil, Guyana, West Africa) stepped into Asia, stretching average voyage lengths. "Crude on water" — the volume in transit at any moment — has pushed above its 2020 floating-storage records even without a contango storage play, purely because barrels are spending more days at sea (EIA). The base case to 2030: seaborne crude volumes plateau with demand, but tonne-miles stay elevated as long as Persian Gulf reliability is discounted and Asian refining runs on Atlantic and Latin American barrels.
If oil is the past of energy shipping, LNG is its most contested present. The United States is lifting LNG export capacity by roughly 30% by 2027 to 18.3 Bcf/d as Golden Pass, Port Arthur, Rio Grande and Corpus Christi Stage 3 commission; Qatar, despite wartime damage to two Ras Laffan trains that will take three to five years to repair, is still on course to expand from 77 to 142 mtpa by 2030 (EIA). The result is a buyers' market in molecules and a sellers' market in ships: Europe's post-Russia re-gasification build-out absorbs cargo, Asia's price-sensitive buyers return whenever JKM dips, and every new train needs dedicated tonnage years before first gas.
The 2026 war added a cruel twist. Qatar's damaged trains remove ~12.8 mtpa from the late-decade balance precisely when the market needs them, and the associated loss of Qatari gas liquids has tightened condensate and LPG trade as well. But directionally the story stands: LNG is the one fossil fuel whose seaborne trade grows robustly through 2030, underwritten by Europe's structural import need, South and Southeast Asian demand growth, and the fuel-switching economics of a market where gas must compete with coal that is itself becoming scarcer in seaborne form.
Coal's obituary keeps being drafted and postponed — but the trade data now point clearly past the peak. Australia's official Resources and Energy Quarterly counts world thermal coal trade at 1,209 Mt in 2024, falling to 1,118 Mt in 2025 and a forecast 1,071 Mt in 2026 — the first two-year decline this century — and projects ~1,007 Mt by 2031, a −1.7% CAGR (Australian Government REQ). Metallurgical coal is stickier: trade rises from 341 Mt in 2025 to ~351 Mt by 2031, powered by India, whose met-coal imports climb from 85 to 108 Mt (+4.1% CAGR) even as China's shrink from 118 to 93 Mt.
The war, paradoxically, gave coal a last cyclical hurrah: with Ras Laffan's damaged trains removing LNG supply for three to five years, Asian utilities lifted coal burn, April 2026 coal exports rose 7.5% year-on-year, and Newcastle thermal coal rallied from $116/t in February to $135/t in March 2026 (Australian Government REQ). Treat it as a reprieve, not a reversal. The investment implication is precise: coal trade still pays for a decade, but it will not underwrite newbuild Capesize demand — a fact the dry-bulk orderbook already reflects.
The Persian Gulf is not only an energy exporter; it is one of the world's great fertilizer basins, supplying roughly a quarter of global urea exports. The closure therefore did double damage: it cut supply and raised the gas feedstock cost of everyone else's production. Urea prices surged about 60% to above $850/t, and the World Bank forecasts fertilizer prices up 31% for 2026 as a whole (World Bank). Because fertilizer demand is the most price-elastic link in the food chain, expensive urea in 2026 means reduced application, lower 2027 yields, and a delayed agricultural price cycle — one of the clearest second-order trades of the outlook period, and one we return to in the agriculture discussion below.
Dry bulk is the largest commodity trade by volume — iron ore, coal and grain alone moved some 3.46 billion tonnes in 2025 — and it is where the most consequential supply-side event of the decade just occurred. Seaborne iron ore trade reached 1.615 billion tonnes in 2025, with China importing a record 1.245 billion tonnes (+4.7%); grain trade hit 532 million tonnes (+1.2%); while coal slid 4% to 1.316 billion tonnes (Clarksons Research).
Then, in December 2025, the first ore sailed from Simandou — the Guinean mega-project with 120 Mtpa of capacity (60 Mtpa SimFer + 60 Mtpa WCS) ramping up over roughly thirty months. The geology matters less than the geography: the Guinea–China run is about 11,350 nautical miles against 3,500 for Australia–China — more than three times the distance. Every tonne of Simandou ore that displaces Australian ore triples the shipping work it generates, which is why forecasters see iron ore seaborne demand growing 2.8% in 2026 and 2.7% in 2027 in tonne terms and materially faster in tonne-mile terms. Add China's bauxite imports — up 26.5% to ~200 Mt, overwhelmingly from Guinea — and West Africa has quietly become the dry-bulk market's new tonne-mile engine.
Here is the dry-bulk setup in three numbers: the fleet's average age is 13 years, the oldest since 2010; 12% of tonnage is over 20 years old and 30% over 15; and the orderbook is just 13–14% of the fleet — with the Capesize segment at 12.4%, with 36% of the existing fleet over 15 years old and only 21 Capesize deliveries in the year to date, down 75% on the fifteen-year average. Newbuild prices, berth scarcity at Asian yards (crowded out by LNG carrier and container orders) and fuel-technology uncertainty have kept owners' pens in their pockets (Clarksons Research).
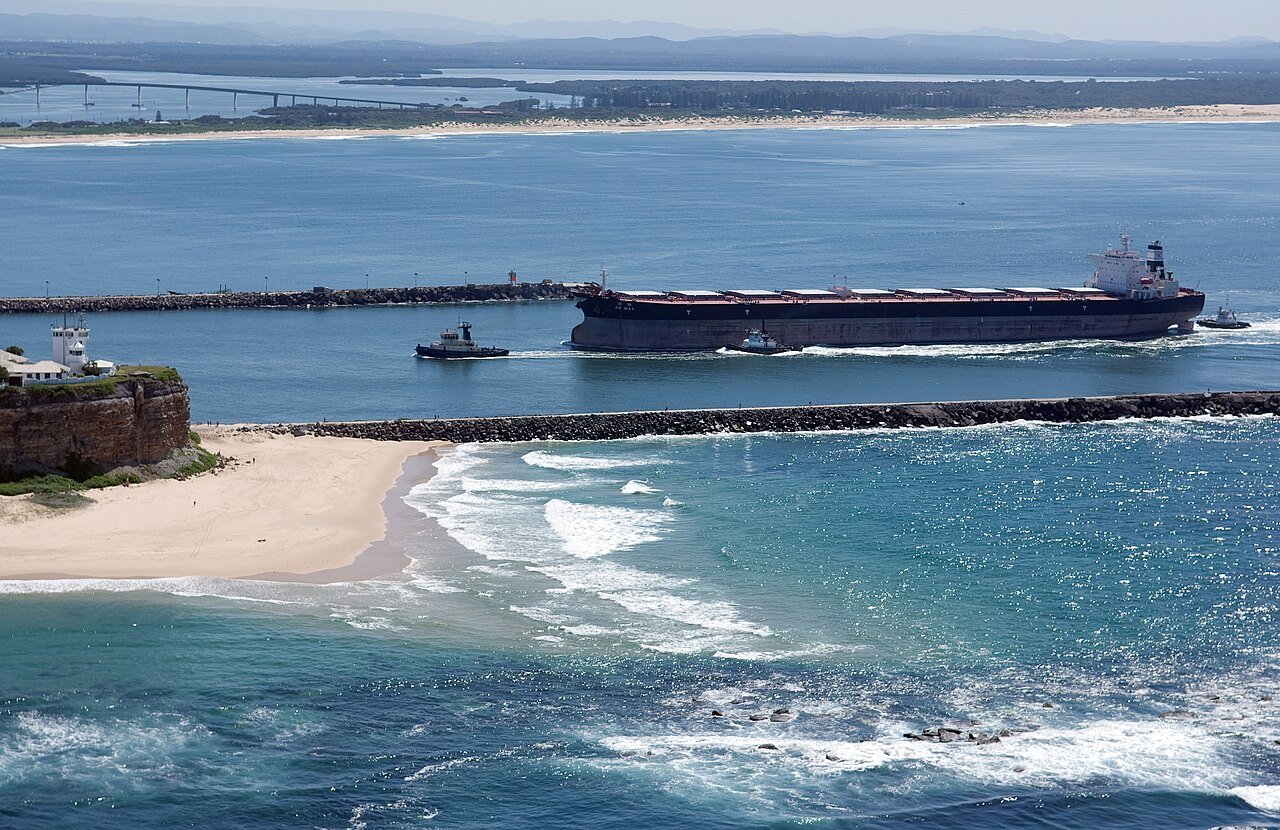
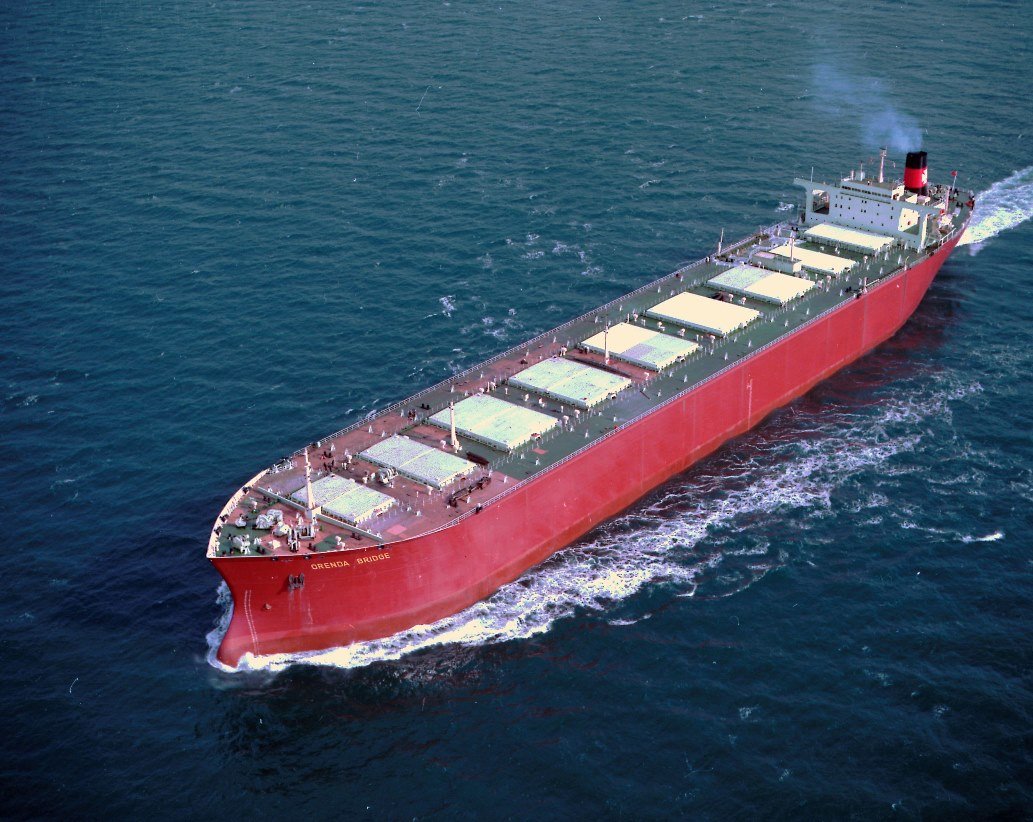
The market has begun to price this in. The Baltic Dry Index averaged 1,678 in 2025, reached 2,501 by end-June 2026 and 3,107 by late August, with Capesize spot earnings around $37,900/day in late July; for 2026 as a whole, Capesize demand growth (+2.7%) is forecast to outrun fleet growth (+2.3%). If Simandou ramps on schedule, Brazilian exports hold, and environmental slow-steaming absorbs another percentage point or two of effective supply, the late 2020s could deliver the tightest Capesize market since the 2000s supercycle — this time built on distance and demography rather than Chinese steel growth.
Agricultural trade enters the outlook period caught between a supply correction and a climate warning. After a record 843.8 Mt wheat harvest in 2025/26, the 2026/27 crop is pegged at 819.1 Mt, and world wheat trade has been cut to 201 Mt (−6.1% year-on-year) on Black Sea disruption and war-driven logistics costs. Yet China still imported 112 Mt of grain in 2025 (+5.8%), and the Middle East's fertilizer shock (Section 3) will be working through planted acreage just as forecasters assign a 61–87% probability to El Niño conditions by mid-2026 (Clarksons Research, World Bank).
The trade-structure story is longer routes and more politics: Black Sea risk premia, Red Sea diversions on Asia-bound grain, and the perennial temptation of export restrictions when food inflation bites — the World Bank's warning of up to 45 million more people at risk of acute food insecurity is precisely the kind of pressure that produces export bans. For grain traders, the 2026–2030 edge lies in origination breadth (Black Sea, South America, Australia) and in freight optionality; for owners, handy-to-supramax tonnage benefits from fragmentation without facing the Capesize's coal-linked demand ceiling.
The metals complex is where the energy transition, the AI build-out and geopolitics collide most directly — and 2026 has been a showcase. LME copper averaged $13,088/t in the first half of 2026, up 39%, with the World Bank forecasting base-metal prices at record levels for the year as a whole (aluminium +22%, copper +21%, tin at an all-time high) (World Bank). UBS sees copper reaching $15,500/t in 2027; gold averaged roughly $4,700/oz in H1 2026 (+53%), silver rose 141%, and lithium carbonate — the cycle's former casualty — rebounded 132% year-on-year as EV and grid-storage demand met disciplined supply (UBS).
The structural anchor is copper. S&P Global projects copper demand rising about 50% to 42 Mt by 2040, while mine production peaks around 33 Mt near 2030 and then declines as grades fall and Tier-1 discoveries fail to appear — leaving a structural deficit on the order of 10 Mt by 2040 (S&P Global). No plausible combination of scrap, substitution and thrifting closes a gap that size at grid-scale electrification growth rates; the deficit must be closed by price — which is why the metal has re-rated even in a year when the World Bank expects the broader metals index to give back 7% in 2027 as the war premium fades.
For physical trade, the actionable trend is not just price but direction of flow. China's twin rounds of rare-earth export controls (April and October 2025, covering seven strategic minerals) demonstrated how quickly critical-mineral policy can become critical-mineral leverage, and the OECD's count of export-restricted vital inputs — up five-fold since 2009 — suggests more episodes, not fewer (OECD). The corporate response is a quiet re-mapping: Western buyers paying premia for ex-China rare earths and magnet materials, concentrate trades rerouting as smelting capacity is built outside China, and Indonesian nickel, Guinean bauxite and Chilean/Peruvian copper concentrates all growing as long-haul seaborne flows.
Gold and silver barely touch dry bulk or tankers, but they matter to this report for a different reason: precious metals +42% in 2026 is the market's verdict on the durability of fiat-debt and geopolitical risk, and it is the same verdict that keeps a floor under commodity risk premia generally. When central banks buy gold at record pace while commodity trade fragments, the signal for traders is to own optionality — and for owners, to remember that risk premia are freight-rate fuel.
One caveat keeps metals traders honest: the World Bank expects iron ore prices to remain below 2020 levels through 2026–27 even as base metals set records (World Bank). Simandou's ramp, steady Brazilian supply and plateauing Chinese steel demand cap the ferrous complex precisely while electrification metals run. The commodity complex of the late 2020s, in short, is not a monolith: it is a widening spread between the metals the grid needs and the bulk commodities of the carbon age — and the shipping demand that follows each.
The tanker market has lived the full cycle in ten months. VLCC earnings averaged $103,500/day in Q1 2026 and $126,800 in Q2 — Frontline's spot-exposed ships printed $152,700 — and stood around $125,400/day quarter-to-date in Q3; Suezmaxes went from $72,400 in Q1 to $123,400 in Q2. In September, Middle East–China VLCC fixtures reportedly touched ~$800,000/day, an all-time record, as charterers paid anything to lift the barrels still able to leave the Persian Gulf (Frontline, Clarksons Research). Clarksons Securities has pencilled in $135,000/day as the 2026 VLCC average.
The sobering counterweight is the orderbook. After years of restraint, owners have ordered 304 VLCCs, 182 Suezmaxes and 221 Aframax/LR2s — 25.4% of the existing fleet. Today 18.3% of VLCCs are over 20 years old; by the time the orderbook delivers, 34.5% of the tanker fleet will be over 20. The resolution of this tension — a flood of new ships against a geriatric fleet the shadow-trade still employs — will define tanker returns in 2028–2030. If sanctions enforcement keeps aging tonnage in the parallel trade and scrapping lags, the delivery wave lands on a soft market; if the shadow fleet is forced out, the market absorbs the orderbook. This is the single biggest binary in shipping.
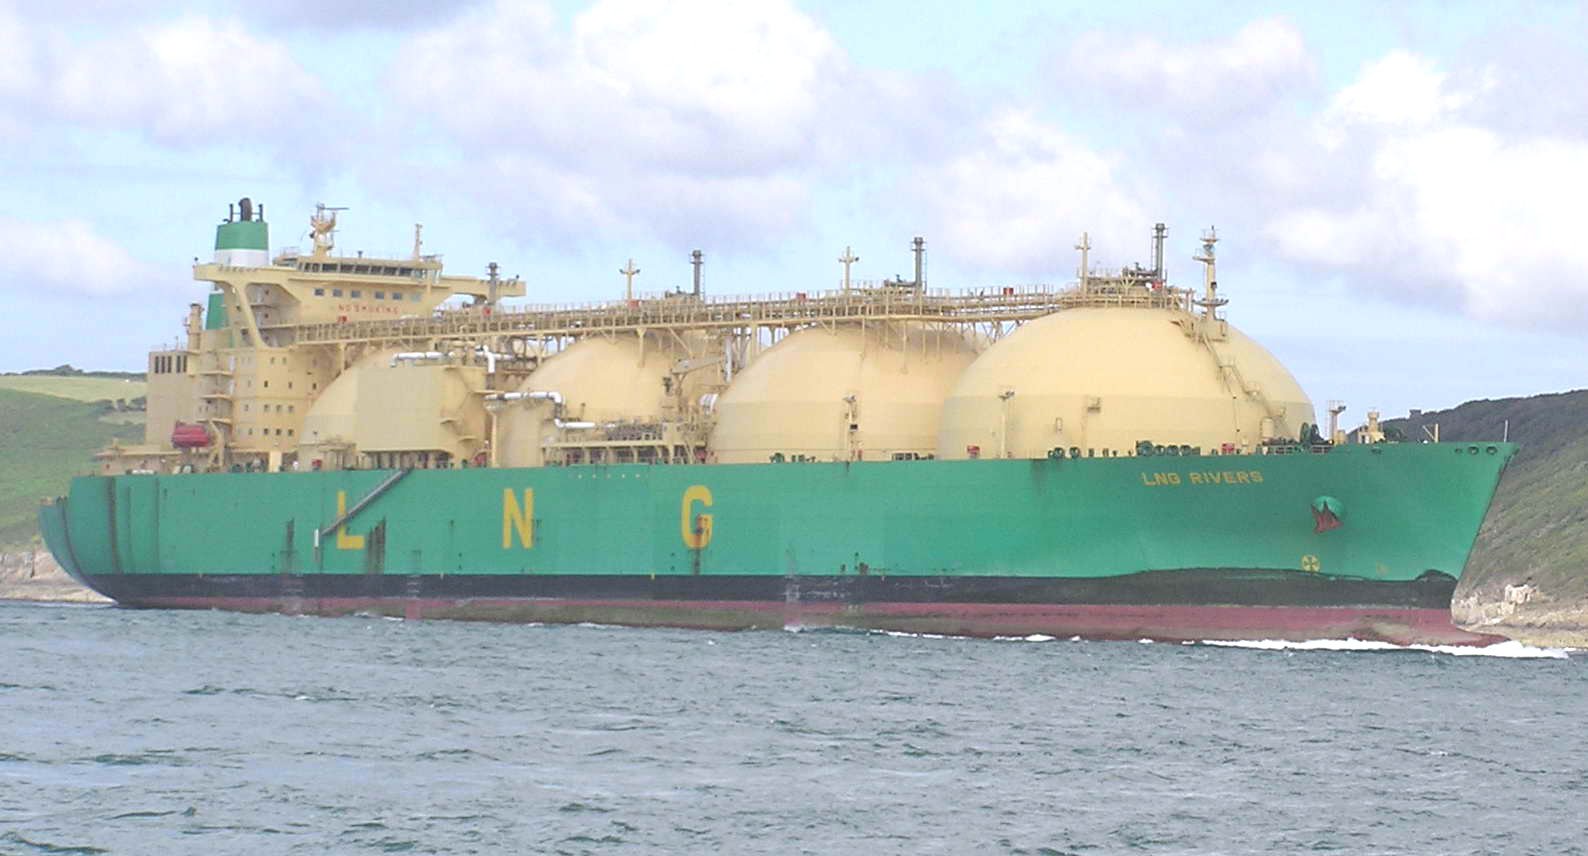
The mirror image is the LNG carrier market, where the fleet of roughly 745–750 ships faces an orderbook near 300 vessels — around 40% of the fleet — against newbuild prices above $250m. Spot rates spent most of 2025 at $20,000–40,000/day, below cash breakeven for modern tonnage, before spiking near $200,000 in the winter; the structural reality is that ships are being delivered today for liquefaction trains (US, Qatar) that commission from 2027 onward. Owners with balance sheets to survive 2026–27 should be rewarded when the molecule wave arrives; the leveraged will not be so lucky. Containers tell a similar oversupply story with a geopolitical overlay: 2026 demand growth of ~2.5% against capacity growth of 3.8–4.5%, a full Red Sea return looking unlikely in 2026, and 129 boxships among the tonnage trapped in the Persian Gulf (Clarksons Research).
Running through every tanker and product-market forecast is the shadow fleet — the aging, opaquely owned tonnage carrying sanctioned Russian, Iranian and Venezuelan barrels. The EU's 21st sanctions package of July 2026 designated 41 more shadow-fleet vessels, even as the price-cap adaptation mechanism was suspended to July 2027 (Council of the EU). The policy dilemma is real: enforce harder and remove effective supply (bullish rates, bullish oil); tolerate and the parallel fleet keeps one in five tankers gainfully employed (bearish scrapping, delayed renewal). Either way, the shadow fleet has become a structural feature of the 2026–2030 market — a floating inventory of old ships whose fate regulators, not owners, will decide.
The IMO's Net-Zero Framework — a two-tier fuel-intensity standard, a GHG pricing mechanism and a Net-Zero Fund — was approved at MEPC 83 in April 2025, then sensationally deferred for a year in October 2025 under US pressure, with the reconvened session landing in October 2026 and the earliest entry into force now March 2028, with enforcement from early 2029 (IMO). The delay has had a measurable behavioural effect: the conventional-fuel share of the newbuild orderbook rebounded to 60.2% as owners postponed fuel-technology bets (Clarksons Research).
But regional carbon pricing is compounding regardless. The EU ETS maritime phase-in steps up from 40% of 2024 emissions to 70% in 2025 and 100% from 2026 (surrendered 2027), and FuelEU Maritime's intensity curve tightens through the period. Meanwhile the industry's vanguard keeps moving: CMB.TECH and Fortescue's order for up to twelve ammonia-powered Newcastlemax bulkers shows that for the biggest cargo owners, the fuel question is now a procurement strategy, not a compliance exercise. The practical read for owners: the decade's fuel economics will be set by a patchwork — EU pricing now, IMO pricing from ~2029 — and the winning technology bets will be dual-fuel flexibility plus efficiency, not single-fuel purity.
Slow-steaming deserves special mention as the market's quiet shock-absorber: every knot of speed reduction absorbs roughly 2–3% of effective fleet capacity. With carbon costs rising, war-risk insurance elevating the value of fuel efficiency, and the fleet's average age at a fifteen-year high, speed is the adjustment variable that will keep converting oversupply on paper into tightness on the water — one more reason headline fleet-growth numbers overstate real capacity.
Bringing the strands together: the base case for the late 2020s is a commodity system that normalizes in price but not in structure. Oil gives back the war premium through 2027 (Brent toward the mid-$70s by Q4 2027 in the EIA's path; $70 average per the World Bank) while retaining a persistent geopolitical floor; LNG tightens into 2027–28 on Ras Laffan damage before the US/Qatar wave lands; coal trade grinds down its −1.7% slope; iron ore volumes grow on Simandou and Brazilian supply with prices capped; grains stay hostage to weather and Black Sea politics; and copper, aluminium and the battery complex re-rate structurally on the deficit arithmetic of Section 5 (EIA, World Bank).
For freight, the base case is a rotation: tanker rates normalize from spectacular to merely strong as Persian Gulf flows return (with the 2028–30 orderbook wave as the key risk), Capesize and Newcastlemax earnings tighten into 2027–29 on Simandou tonne-miles and negligible ordering, LNG shipping bottoms and then rides the liquefaction wave, and containers bleed through their capacity glut. Overlaying it all: the IMO framework's arrival from 2028–29, EU carbon costs at 100%, and a sanctions architecture that keeps a fifth of the tanker fleet in the shadows.
The interim US–Iran deal holds; mines swept by mid-2027; Persian Gulf flows return. Brent $74 by Q4 2027, commodity prices −6 to −7% in 2027 (metals), then a plateau: oil demand flat ~102–104 mb/d, LNG trade up strongly, coal down slowly, copper grinding to record highs.
The ceasefire collapses or the interim deal lapses; the strait re-closes. World Bank adverse case: Brent $95–115 sustained, energy +24% becoming +40%+, fertilizers and food inflation re-accelerating, up to 45m more people food-insecure. Freight: tonne-miles and war-risk premia explode again.
A durable settlement plus a China slowdown: 10+ mb/d of shut-in capacity returns into a market where WTO trade growth is 0.5% and China is destocking. Oil overshoots below $60, dry bulk absorbs Simandou into flat steel demand, and the 2028 tanker orderbook delivers into weakness.
| Complex | 2026 reality | 2027–28 path | 2029–30 structure | Key risk |
|---|---|---|---|---|
| Crude oil | Brent avg $86 (WB); Q4 $105 (EIA); ~4.8 mb/d still shut in Sept | $87 → $74/bbl as shut-ins return; Atlantic barrels keep Asia share | Demand plateau 102–104 mb/d (IEA STEPS); OPEC/BP see peak ~103–113 ~2030 | Deal collapse; OPEC+ response to returning supply |
| LNG | Ras Laffan −12.8 mtpa for 3–5 yrs; spot shipping $20–40k/day | US +30% export capacity by 2027; buyers' market in molecules | Qatar 77→142 mtpa by 2030; carrier oversupply absorbed | Liquefaction delays vs fleet delivery timing |
| Coal | Seaborne −4%; first two-year decline this century | Thermal trade 1,071 Mt (2026) → declining ~1.7%/yr | ~1,007 Mt by 2031; met coal to India the growth pocket (+4.1% CAGR) | Gas-price spikes reviving burn (as in 2026) |
| Iron ore | Seaborne 1.615 bn t; Simandou first ore Dec 2025 | Simandou ramps to 120 Mtpa over ~30 months; tonne-miles +3× on Guinea route | Prices capped below 2020 levels; volume +2.7%/yr, distance the kicker | Chinese steel demand; ramp delays |
| Grains | Wheat trade 201 Mt (−6.1%); urea >$850/t | Fertilizer affordability hits acreage; El Niño 61–87% probability | Trade re-routes Black Sea / S. America / Australia; policy risk chronic | Export bans under food-inflation pressure |
| Copper / crit. minerals | LME H1 avg $13,088/t (+39%); lithium +132% | UBS $15,500/t 2027; metals index −7% in 2027 as war premium fades | Demand 42 Mt by 2040 vs mine peak ~33 Mt ~2030 → structural deficit | China export-control escalation; substitution |
| Tankers | VLCC avg $126.8k Q2; record ~$800k/day Sept ME–China | Normalization toward strong five-figure rates as Persian Gulf returns | Orderbook 25.4% delivers vs 34.5% of fleet >20 yrs — renewal binary | Shadow-fleet enforcement; delivery wave |
| Dry bulk | BDI 1,678 avg '25 → 3,107 Aug '26; Capes ~$37.9k/day July | Cape demand +2.7% vs fleet +2.3%; 21 Cape deliveries YTD (−75%) | Orderbook ~13–14%; avg fleet age 13 yrs — late-decade squeeze setup | China property; Simandou slippage |
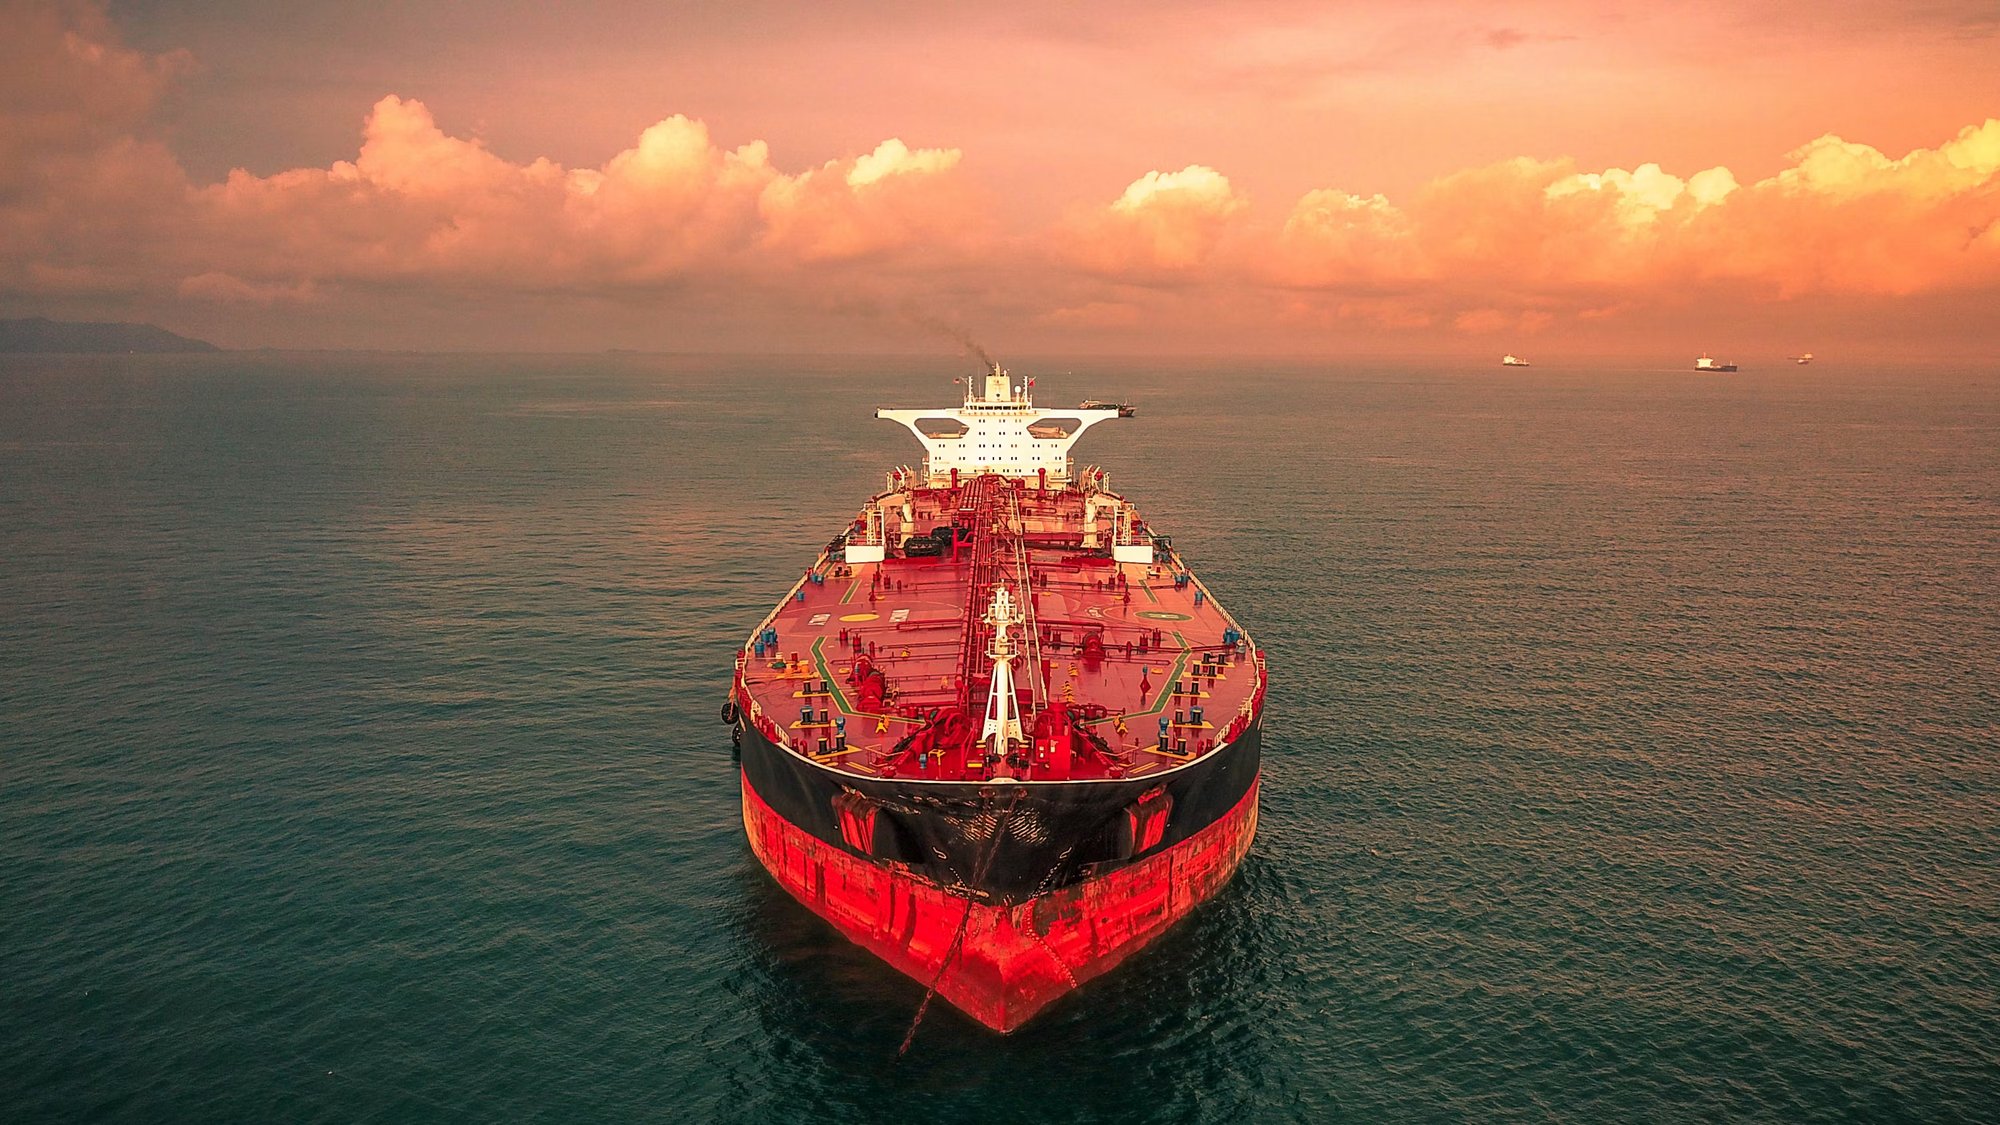
Sources: EIA STEO (Oct 2026); World Bank CMO (Apr 2026); Clarksons Research; Australian Government REQ (Jun 2026); IEA; S&P Global; company disclosures. Figures as cited in the sections above.
The windfall evidence is unambiguous: Trafigura earned $4.1bn net profit in the six months to March 2026 with EBITDA nearly doubling to $7.9bn, and Vitol's 2025 net profit of ~$4.5bn continued a three-year average above $12bn (Trafigura, Vitol). These were not lucky years; they were the payoff to balance sheets, logistics and optionality assembled in quiet ones. What follows is where the next five years reward preparation.
Owners enter 2027 with record cash (tankers), a five-year-high average fleet age, and an orderbook that is simultaneously too big (LNG, tankers) and too small (dry bulk). The strategic through-lines:
"The winners of the next cycle are being decided now — not in the freight market, but in the orderbook restraint and balance-sheet choices of the war years."Closing thought