The AI Energy Revolution: How Artificial Intelligence Is Reshaping Global Energy Demand and the Map of Power
By Dr Sam Tari Verdi, Founder of ShipPulse.com
Executive Summary
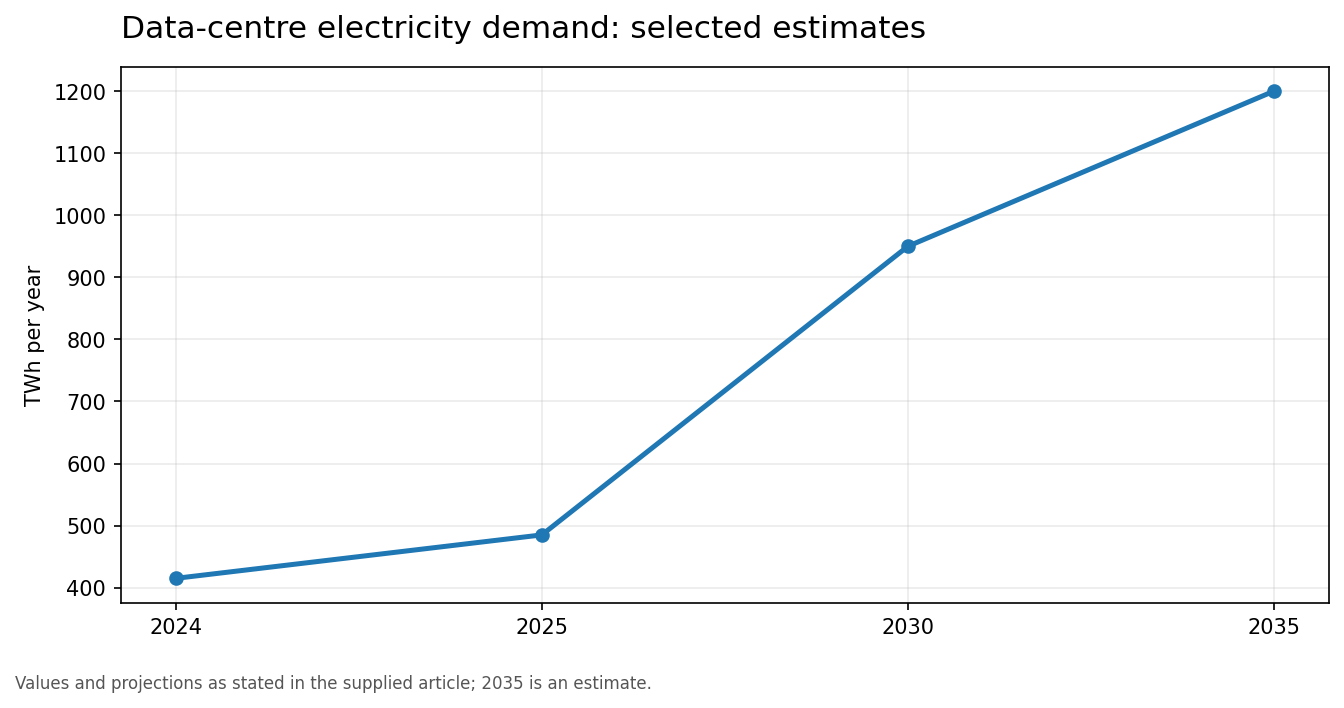
Artificial intelligence has quietly become one of the most consequential forces in global energy markets. In 2025, data centers consumed roughly 485 terawatt-hours (TWh) of electricity — about 1.5% of everything the world generated — and AI-focused facilities alone accounted for roughly one-third of that, around 155 TWh. The International Energy Agency (IEA) projects that total data center demand will roughly double to ~950 TWh by 2030, reaching about 3% of global electricity consumption, while AI-focused data center consumption more than triples over the same period.
This article maps the correlation between AI demand and energy consumption, explains the structural drivers, draws the new "global energy change map" — where demand is concentrating, and how the energy system is responding through renewables, natural gas, nuclear restarts, and small modular reactors — and identifies the strategic risks and opportunities for the next decade.
1. From Bits to Electrons: Why AI Is an Energy Story
Every AI query, training run, and inference call is, at its core, a conversion of electricity into computation. AI is not an abstract software phenomenon; it is a physical industrial process with a measurable power draw, a cooling load, a land footprint, and a grid connection.
Three structural characteristics make AI different from earlier waves of digital demand:
Power density. Traditional data center racks draw 5–15 kW. AI-optimized racks packed with GPUs or TPUs now draw 40–60+ kW, with cutting-edge AI training racks exceeding 100 kW. A single accelerated server can consume 3,000–5,000 watts, ten times a conventional CPU server.
Continuous load. Training frontier models requires thousands of chips running at full utilization for weeks or months. Unlike consumer digital services with daily peaks and troughs, AI workloads demand firm, 24/7 power — the exact profile that intermittent generation struggles to serve.
Jevons dynamics. Efficiency gains per query are real — Google reports cutting median energy per Gemini prompt by a factor of 33 between May 2024 and May 2025 — but as unit costs fall, total usage explodes. The IEA's projection that data center electricity demand will double by 2030 is made in spite of anticipated efficiency improvements.
The correlation, in short, is this: AI adoption → accelerator shipments → installed compute capacity → electricity demand. The IEA's model shows that electricity consumption from accelerated servers (the chips that run AI) is projected to grow ~30% per year, accounting for almost half of the net increase in global data center electricity consumption to 2030.
2. The Numbers: Global Energy Consumption Today and Tomorrow
2.1 Where we are
- 2024: Data centers consumed ~415 TWh, ≈1.5% of global electricity, growing at ~12% per year since 2019 — more than four times faster than total global electricity demand.
- 2025: Data center consumption grew 17% to ~485 TWh. AI-focused data centers grew far faster — roughly 50% in a single year — reaching ~155 TWh, or about 0.5% of global electricity. That is roughly equivalent to the annual electricity generation of Germany.
- Context: if data centers were a country, they would already rank among the world's largest electricity consumers — by one estimate approaching the fifth-largest, between Japan and Russia.
2.2 Where we are going
| Indicator | 2024/25 | 2030 (IEA base case) | 2035 (IEA) |
|---|---|---|---|
| Total data center electricity | ~415–485 TWh | ~945–950 TWh (~3% of global) | ~1,200 TWh (range 700–1,700) |
| AI-focused data centers | ~155 TWh (2025) | ~465 TWh (3x increase) | Growing further |
| US data center demand | ~4.4–5% of US electricity | +130% vs. 2024; ~9%+ of US electricity | Rising |
| Cumulative data center investment | — | ~USD 3.9 trillion (2026–2030) | — |
| Powering investment | — | USD 0.5–1 trillion by 2030 | — |
Globally, data centers account for roughly 9% of projected electricity demand growth to 2030. But in the United States — home to ~45% of global data center capacity — they could account for half of all demand growth, because other sources of demand growth (EVs, industrial electrification) are comparatively modest there.
3. The New Geography of Power: A Global Energy Change Map
The defining feature of AI-era energy demand is concentration. Global demand is not spreading evenly; it is clustering into a handful of electricity "hotspots," redrawing the map of where power infrastructure, investment, and policy attention flow.
3.1 North America: The Epicenter
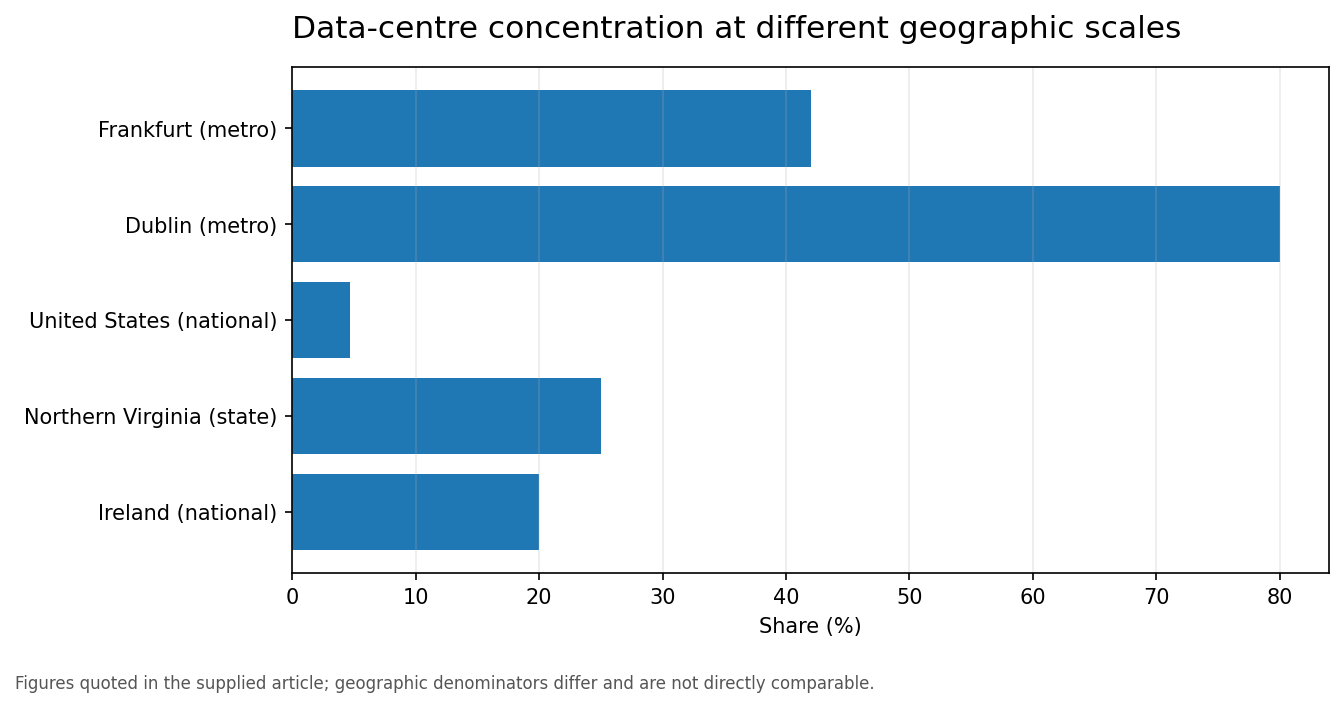
The US hosts roughly 45% of global data center electricity consumption. Nearly half of US data center capacity sits in five regional clusters, led by Northern Virginia — the world's largest data center market — where data centers already exceed a quarter of state electricity demand. At least five US states now see data centers consuming more than 10% of their generation. US data center demand is forecast to rise ~130% by 2030, with LBNL projecting consumption of 325–580 TWh by 2028 (up from 176 TWh in 2023).
3.2 Europe: High Penetration, Tight Grids
European data centers consumed roughly 150 TWh in 2026 projections, but the striking story is national concentration: Ireland's data centers now consume more than 20% of national electricity — a share few industries in history have ever reached in any advanced economy. The EU's Energy Efficiency Directive now mandates emissions reporting for data centers above 500 kW, and several European markets face moratoria or grid-connection queues. Northern Europe (Nordics) is emerging as a favored destination thanks to abundant hydro, wind, and cool climates — exemplified by the $4 billion acquisition of Iceland-based at North by Equinix and CPP Investments.
3.3 China and Asia-Pacific: Scale with Constraints
China's data center demand sits between the US and Europe in absolute terms, with strong state coordination but constraints in power-hungry eastern provinces pushing compute toward western regions with surplus renewables ("East Data, West Computing"). Singapore, long a hub, has tightly controlled new data center capacity because of land and energy limits, while Japan and India are seeing growing PPA activity as operators seek clean energy where nuclear procurement is less mature.
3.4 The Gulf and Beyond: New Entrants
The map is expanding. Microsoft's $15.2 billion UAE investment and major projects across the Gulf signal a search for jurisdictions offering cheap, abundant power (gas and increasingly solar) and permissive regulation — effectively a global arbitrage for electricity.
The changed map, in one sentence: the world's AI compute — and therefore a growing share of its incremental electricity demand — is being concentrated into a few dozen grid interconnection points across Virginia, Texas, Ireland, the Nordics, Singapore, and the Gulf, creating local bottlenecks even where global capacity looks ample.
4. The Geopolitical Shift: From Control of Fuel to Control of Intelligence
The geography of power is changing. For much of the twentieth century, strategic wealth was closely associated with control of energy resources, industrial capacity and the arms industry. Oil and gas reserves, refineries, pipelines, ports and shipping lanes shaped alliances and competition. In the AI era, these foundations remain important, but a further source of power is emerging: the ability to turn energy, advanced chips, data and capital into intelligence at scale.
4.1 A different resource-security strategy
Traditional energy security prioritised access to fuel and the routes that move it. AI-era resource security must also include reliable electricity, resilient grids, semiconductor manufacturing, advanced computing equipment, cooling water, critical minerals, data infrastructure and specialist skills. These needs are interconnected: a country may possess abundant energy yet capture limited value if it lacks the networks, technology and talent needed to host and develop advanced computing.
4.2 From territorial control to network control
Influence increasingly depends not only on who owns a resource, but on who controls the systems that transform it into economic and strategic advantage. Data centres depend on power markets and grids; chip production depends on highly specialised supply chains; AI deployment depends on software, data, talent and secure communications. These networks create new dependencies and new points of vulnerability.
4.3 The arms industry remains part of the equation
This is not a simple replacement of energy and defence by technology. AI is becoming embedded in defence, surveillance, logistics, autonomous systems and industrial planning. Energy companies, technology firms and defence manufacturers are increasingly interdependent. Strategic advantage will often accrue to those able to coordinate all three, rather than to one sector in isolation.
4.4 The new competition for resources and influence
Energy-producing states can attract data-centre investment by offering reliable power, land and capital. But hosting infrastructure alone does not guarantee lasting prosperity. The larger opportunity is to build local research capacity, technical skills, digital industries and resilient supply chains so that more of the value remains in the domestic economy. Countries without abundant domestic energy may still compete through grid interconnection, efficient infrastructure, advanced manufacturing and strong research ecosystems.
4.5 The central geopolitical thesis
The strategic contest is expanding from securing fuel to securing the full chain that converts energy into intelligence. Energy remains a foundation of power; advanced technology increasingly determines how effectively that foundation can be used. The next era will be shaped by the intersection of energy, computing, capital, critical materials and security.

4. How the Energy System Is Responding: The Supply-Side Transformation
AI's demand shock is colliding with an energy system built on decades-long lead times. The response is unfolding along four tracks:
4.1 Renewables: Still the Fastest-Growing Source
Renewables remain the fastest-growing source of electricity for data centers, expanding at ~22% per year and meeting nearly half of data center demand growth through 2030 — much of it financed by corporate power purchase agreements. Solar-plus-storage has become a strategic tool: behind-the-meter configurations can bypass congested grid queues entirely, which is why hyperscalers have contracted over 50 GW of clean energy globally. Intermittency, however, remains the Achilles' heel for 24/7 AI loads.
4.2 Natural Gas: The Bridge That Is Being Used
Natural gas and coal together are expected to meet over 40% of the additional electricity demand from data centers until 2030, through higher utilization of existing plants and new gas-fired capacity. Gas turbines have become a de facto bottleneck asset — the industry shorthand "gas turbines are the new GPUs" captures how the demand shock has spilled directly into fossil backup.
4.3 Nuclear: From Decline to Renaissance
The most striking shift on the energy map is nuclear revival, driven directly by AI:
- Microsoft — Three Mile Island: a 20-year, 837 MW restart agreement with Constellation Energy, reportedly at a premium fixed rate.
- Amazon — Talen/Susquehanna: a 17-year, 1.92 GW PPA and $20 billion Pennsylvania investment, including a 960 MW nuclear-powered campus.
- Meta × Oklo: a 1.2 GW power campus in Ohio with 16 Aurora reactors, targeting first power by 2030.
- Google × Kairos Power: the first corporate SMR PPA, 50 MW scaling to 500 MW by 2030.
- Equinix: agreements for over 1 GW of advanced nuclear (Oklo, Stellaria, Rolls-Royce SMRs) plus 100+ MW of on-site fuel cells.
- OpenAI-backed Oklo has a customer pipeline exceeding 14 GW; technology companies have plans to finance more than 20 GW of SMRs.
Roughly a third of US nuclear plant owners are reportedly in talks with tech companies. By 2035, the IEA projects low-emissions sources (renewables + nuclear) will supply over half of US data center electricity, with coal-fired generation for data centers in absolute decline.
4.4 Grid Bypass and Self-Generation
Facing interconnection queues of up to a decade in some markets, operators are moving power on-site: fuel cells (Equinix/Bloom Energy, 100+ MW), co-located solar-plus-storage, and dedicated on-campus reactors. This "grid bypass revolution" is redrawing the line between electricity customer and utility — hyperscalers are becoming energy companies in their own right.
5. The Correlation Framework: Demand, Investment, and Emissions
The correlation chain can be summarized as follows:
AI adoption rate → accelerator shipments (~2.2x by 2030) → data center buildout (~3.9trillioncumulative2026–2030) → electricitydemand( 950TWhby2030) → generationinvestmentandgridinfrastructure(0.5–1 trillion) → fuel mix outcomes and emissions.
Three second-order correlations deserve emphasis:
- Demand → equipment supply chains. The AI boom is tightening critical mineral and power-equipment supply chains (transformers, switchgear, turbines), with multi-year backlogs — directly delaying both data centers and grid upgrades.
- Demand → emissions: ambiguous. Data centers currently drive ~1% of global energy-related CO2 emissions. The net effect depends on the supply mix: gas-heavy growth raises emissions; nuclear/renewables-heavy growth decarbonizes. The IEA notes AI's broader deployment could enable system-wide emissions savings in transport, buildings, and industry that potentially offset its own footprint.
- Demand → electricity prices and equity. Behind-the-meter nuclear deals have triggered regulatory pushback (e.g., PJM stakeholders arguing ~$140 million in costs could shift to other customers), and data center load concentration is raising local price and reliability concerns — the social license question of the AI era.
6. Six Unique Analytical Lenses on the AI–Energy Correlation
Most commentary repeats the same headline numbers. This section offers six original ways of looking at the problem that most analyses skip.
6.1 Lens 1 — Elasticity decomposition: how much of AI's growth is energy, and how much is efficiency?
AI compute demand and AI electricity demand are not growing at the same rate, and the gap between the two growth rates is the cleanest measure of technological progress.
- Frontier-model training compute has historically grown roughly 4× per year; AI-focused data centre electricity is growing roughly 50% per year; accelerated-server electricity consumption grows ~30% per year (IEA).
- The implied short-run elasticity of AI energy demand to AI compute demand is therefore roughly 0.3–0.5: for every doubling of compute, electricity rises by only ~25–40%.
- Interpretation: efficiency is absorbing more than half of the compute explosion. But because the base is compounding, even a low elasticity produces absolute energy growth of 30–50% per year. The AI energy problem is not a failure of efficiency — it is efficiency losing a race against exponential adoption. This is the Jevons paradox restated in econometric form.
6.2 Lens 2 — Capacity, not energy, is the true binding constraint
Headlines track TWh; grid operators track GW. A data centre with a 90% load factor consumes roughly as much energy per GW as a baseload power plant produces — but unlike residential demand, it does not diversify statistically across millions of customers. It arrives as a single, lumpy, simultaneous block.
The practical consequence: serving 1 GW of new data-centre load requires roughly 1.2–1.4 GW of firm, deliverable capacity once reserve margins are added — and it requires it at one substation, on one schedule. This is why grid connection queues stretch toward a decade in Northern Virginia even while national reserve margins look adequate. The AI energy crisis is, in engineering terms, a deliverability and capacity-adequacy crisis, not an aggregate energy crisis. That single insight explains why the stress appears in Virginia, Ireland, and Singapore — and not in the global averages.
6.3 Lens 3 — The capacity auction as a revealed-preference thermometer
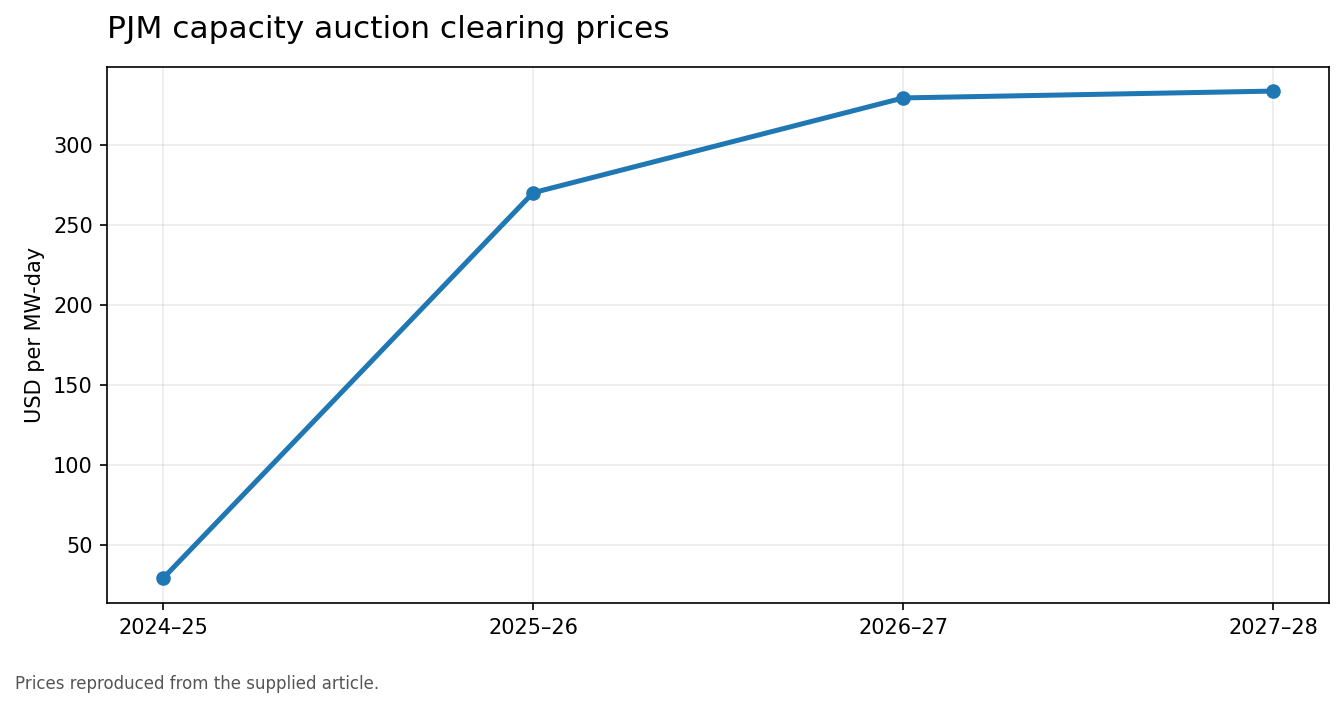
There is a market that prices AI demand directly: forward capacity auctions. PJM's Base Residual Auction is the world's cleanest natural experiment in the correlation between AI demand and the cost of power system adequacy:
| Delivery year | Clearing price ($/MW-day) | Driver |
|---|---|---|
| 2024–25 | $28.92 | Market trough |
| 2025–26 | $269.92 | +833% — data-centre surge |
| 2026–27 | $329.17 | Price cap reached |
| 2027–28 | $333.44 | Cap reached again; 6.6 GW short of reliability target |
PJM's independent market monitor attributes 63% of the 2025–26 price increase — $9.3 billion in a single year — to data-centre load, and estimates data centres at $6.5 billion of the $16.4 billion total capacity cost. In the Dominion Zone (Northern Virginia), forecast data-centre growth leapt from ~5,700 MW by 2037 (2022 forecast) to over 20,000 MW (2025 forecast). NRDC projects $100–163 billion in cumulative costs through 2033.
The analytical point: capacity prices are a revealed measure — they cannot be fudged by accounting choices the way corporate emissions or PPA claims can. When a market that clears futures for 67 million people reprices adequacy eleven-fold in two years, the AI demand shock has moved from narrative to invoice. (See chart 2.)
6.4 Lens 4 — The water–energy nexus: AI's second resource shadow
Energy is only half the physical footprint. A typical 100 MW AI data centre consumes 1.5–3.0 million cubic metres of water per year for evaporative cooling; US data centres consumed ~17 billion gallons in 2023, with hyperscale direct consumption projected at 16–33 billion gallons annually by 2028. Per-query estimates for ChatGPT-class systems range from ~0.05–0.5 ml of water.
Two original observations follow. First, water demand is thermally coupled to compute: unlike electricity, it cannot be procured via a PPA in another state — a data centre in Phoenix competes with agriculture and households for the same watershed, making siting a genuinely hydro-geographic decision. Second, the policy frontier has shifted: liquid-cooled (closed-loop) designs cut direct water use 70–95% but raise capex, meaning water strategy is now a capital-allocation variable inside hyperscaler boardrooms, not an ESG afterthought.
6.5 Lens 5 — The embodied-energy ledger: chips have a carbon history
Operational electricity dominates the debate, but it is only part of the ledger. Fabricating an advanced logic chip is one of the most energy-intensive manufacturing processes on Earth: semiconductor fabs require ultra-pure water, relentless cleanroom HVAC, and multiple passes of lithography on every wafer. TSMC's fab complex alone consumes roughly 6% of Taiwan's electricity, and leading-edge nodes have seen per-wafer energy intensity rise with every generation even as per-transistor efficiency improves.
The analytical implication is a lifecycle split that shifts over time. For a GPU running flat-out for five years, operational electricity dominates total footprint; but as hardware refresh cycles compress under competitive pressure — accelerator generations now turning over in 2–3 years — the embodied share rises. An AI boom that doubles chip shipments every 18 months therefore pulls forward an enormous manufacturing energy demand concentrated in Taiwan, South Korea, and Arizona fabs — a geography of embodied AI energy that never appears in data-centre electricity statistics. A rigorous assessment of AI's energy correlation must add the fab to the facility.
6.6 Lens 6 — 24/7 CFE matching as the new discipline
Annual renewable matching is becoming untenable as a claim: buying annual solar PPAs while consuming 24/7 from a gas-heavy grid is increasingly challenged (Google's own CFE% metric sits far below 100% in most grids). The emerging standard — hourly, location-matched carbon-free energy — effectively converts AI demand into a long-duration storage and firm-clean procurement engine. Under this lens, the AI boom is best understood as an accidental but enormous financing mechanism for grid storage, geothermal, and advanced nuclear. Every GW of AI load with a 24/7 CFE commitment pulls forward roughly 2–4 GWh of storage and firming investment — a correlation that works for decarbonisation even where it strains the grid.
7. Scenarios, Uncertainties, and What Would Change the Map
The IEA's scenarios through 2030 vary narrowly (~100 TWh around 945 TWh) because near-term supply is largely locked in by project pipelines and equipment bottlenecks; beyond 2030 the divergence widens dramatically (700–1,700 TWh by 2035). The swing variables:
- Inference vs. training mix — 80–90% of AI compute is inference, and agentic, multimodal workloads multiply compute per task. Inference is the volume business of AI energy.
- Chip efficiency — 3D stacking, co-packaged optics, and new architectures may deliver step-change gains, or be swallowed by Jevons rebound.
- Supply-chain bottlenecks — transformers, turbines, nuclear licensing (now capped at 18 months in the US), and HALEU fuel.
- Capital markets — ~USD 3.9 trillion of cumulative data-centre investment (2026–2030) cannot be funded from tech balance sheets alone; sentiment toward AI ROI will shape everything, as will the ratepayer backlash now visible across at least a dozen US states.
8. Conclusion: The Map Is Being Redrawn in Real Time
Read through these six lenses, the AI–energy correlation is neither a simple panic story nor a simple green story. It is a compounding efficiency race (Lens 1) running into a capacity and deliverability wall (Lens 2), priced transparently by markets (Lens 3), shadowed by a second resource constraint in water (Lens 4), carrying a large embodied-energy ledger (Lens 5), and potentially financing the firm-clean transition faster than any policy has (Lens 6).
The geography is the message. Global averages still look modest — ~3% of world electricity by 2030 — but the map shows Dublin at ~80% of metro demand, Frankfurt at 42%, Northern Virginia at a quarter of a state. AI energy is a story of concentration: compute is power, power is location, and location is strategy. The jurisdictions that solve deliverability first — through nuclear restarts, SMRs, behind-the-meter clean firming, and fair cost allocation — will hold the map's new centres of gravity.
Figures
Key Sources
- IEA, Energy and AI (2025) and Key Questions on Energy and AI (2026)
- IEA, Energy demand from AI (2026 update)
- Lawrence Berkeley National Laboratory / US DOE, 2024 United States Data Center Energy Usage Report
- Our World in Data, How much energy do data centers and artificial intelligence use? (2026)
- Brookings Institution, Global energy demands within the AI regulatory landscape (2026)
- IEEFA / Monitoring Analytics / NRDC analyses of PJM capacity auctions (2025–2026)
- S&P Global, Global data center power demand to double by 2030 (2025)
- US EIA, Annual Energy Outlook 2026